| Jurisdiction | Frameworks | Frameworks (n) | Total elements |
|---|---|---|---|
| US | NICE v2.2.0, DCWF v5.1, Cyber.org K-12 v1.0, CSTA K-12 CS (Rev 2017), CSTA PK-12 CS (2026) | 5 | 8,010 |
| CZ | CyQUAL 1.2.0 | 1 | 3,340 |
| SG | OTCCF v1.1 | 1 | 1,612 |
| SA | SCyWF 1.5 | 1 | 1,419 |
| CA | CCSSF 2022 | 1 | 1,345 |
| EU | ECSF v1, DigComp 3.0 | 2 | 1,274 |
| global | SFIA 9, ACM/IEEE CSEC2017 | 2 | 861 |
| UK | CyBOK v1.1.0 | 1 | 596 |
How is element coverage distributed across US and EU frameworks?
The US-to-EU element ratio, reframed
Cross-framework
Workforce
Cross-jurisdictional
Total element coverage across the framework corpus, split by jurisdiction. The US versus EU element-count ratio is the headline figure. What it does and does not say about the underlying frameworks is the point.
NoteScope note
The corpus now spans 8 jurisdictions. This page compares two of them. Those two hold about 50% of the corpus by element count, so read what follows as one comparison inside a wider table rather than as a partition of the whole. A fuller cross-jurisdictional treatment is to follow.
The question
How does total element coverage in cybedtools split across the US and EU frameworks, and what does the gap reflect?
Why it matters
Total element counts are an obvious cross-framework metric to reach for. They are also the easiest to misread. A reader who sees one jurisdiction’s element count vastly exceeding another’s may infer that the lagging jurisdiction is undercovered. The actual story is more often that the two jurisdictions chose different design philosophies for their workforce taxonomies.
The cybedtools corpus pulls 5 US frameworks (NICE, DCWF, Cyber.org K-12, CSTA), 2 EU frameworks (ENISA ECSF, DigComp 3.0), 2 global frameworks (SFIA, ACM/IEEE CSEC2017), and one each from the Czech Republic (CyQUAL), Canada (CCSSF), and Singapore (OTCCF). The element-count ratio between the US and EU rows is large and worth naming, but the framing matters more than the figure.
The result
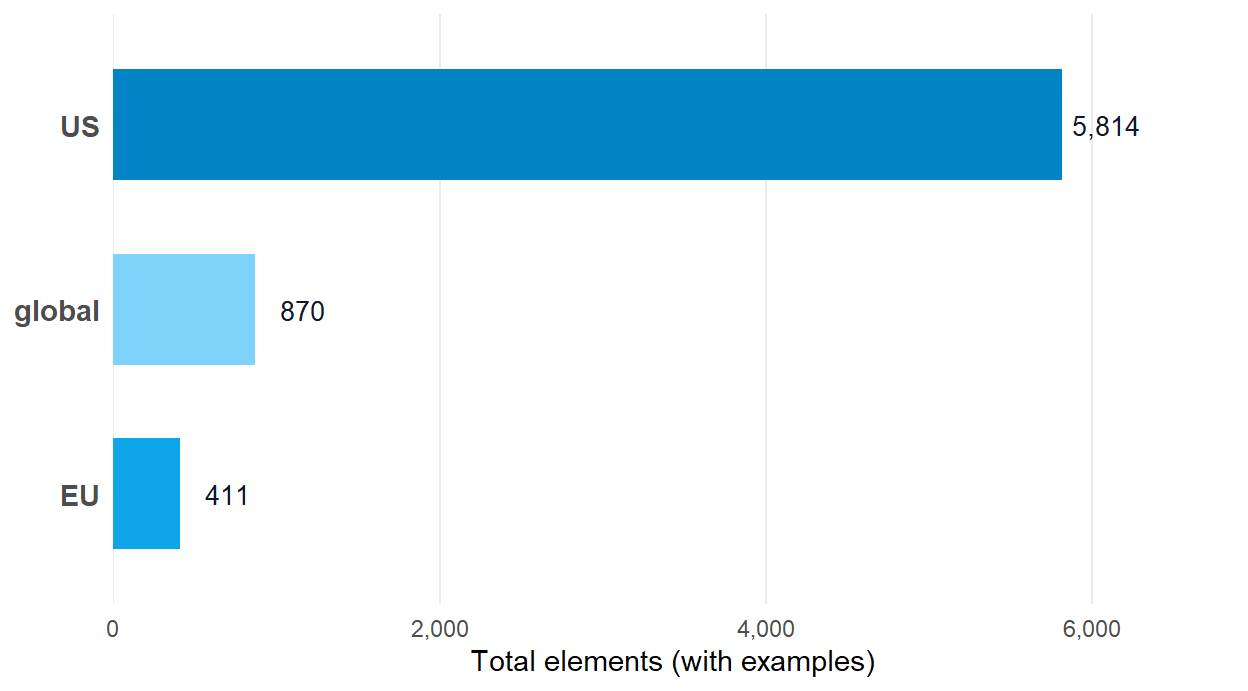
The 5 US frameworks contribute 8,010 elements. The 2 EU frameworks contribute 1,274. That ratio runs at roughly 6.3 to one. The global frameworks add 861 more, the Czech framework 3,340, the Singaporean framework 1,612, and the Canadian framework 1,345, for a corpus total of 18,457.
What this tells us
The ratio reflects design philosophy, not effort
NICE and DCWF were built to specify the US federal civilian and defense cyber workforces at hiring-pipeline granularity. The element count is the point. ECSF was authored as an EU-wide interoperability frame at profile granularity, deliberately light at the per-profile level. DigComp 3.0 specifies citizen-level digital competence, two organizing-unit tiers deep but deliberately compact per unit. The frameworks were built to do different jobs.
A materialization gap sits on the EU side
ECSF profiles point at the European e-Competence Framework (e-CF 4.0) at fine granularity, and those cross-references are not expanded into RDF triples in the cybedtools graph. DigComp 3.0’s proficiency-level descriptors and glossary are staged from the source but likewise not emitted as queryable nodes. Both gaps mean cybedtools’ EU element count understates what those frameworks actually specify.
Reading the ratio as a coverage gap is wrong
US workforce frameworks were designed for US workforce-planning purposes. EU frameworks were designed for EU interoperability and citizen-self-assessment purposes. The 6.3-to-one figure is what those design choices look like at the element layer, and each of the other four rows in the table reflects a further set of design choices.
What this doesn’t tell us
Element counts aren’t the only metric
Concept depth, real-world adoption, regulatory force, and steward-community size all matter for cross-jurisdictional comparison and none of them appear in this figure.
Four jurisdictions sit outside this view
6 of the 8 jurisdictions in the table are neither US nor EU, and together they carry 9,173 elements. SFIA and CSEC2017 don’t fit cleanly into either bucket. SFIA is UK-anchored with global commercial uptake. CSEC2017 is a joint ACM/IEEE/AIS/IFIP product. The Czech, Canadian, and Singaporean national frameworks each answer to their own steward and their own workforce. All of them contribute element coverage that a two-bloc comparison does not reach.
The cybedtools materialization is partial on the EU side
The figure understates EU specification depth because the e-CF cross-references and DigComp Annex examples aren’t yet extracted.
Reproduce this
The framework_summary tibble ships with the package as a lazy-loaded data object. Element totals are jurisdiction-attributed at the framework level via the jurisdiction column.