| Rank | NICE work role | Element count | Share of total (%) |
|---|---|---|---|
| 1 | Security Control Assessment | 307 | 5.7 |
| 2 | Secure Systems Development | 232 | 4.3 |
| 3 | Cybersecurity Architecture | 219 | 4.1 |
| 4 | Defensive Cybersecurity | 206 | 3.9 |
| 5 | Systems Security Management | 204 | 3.8 |
| 6 | Digital Forensics | 182 | 3.4 |
| 7 | Digital Evidence Analysis | 175 | 3.3 |
| 8 | Insider Threat Analysis | 169 | 3.2 |
| 9 | Threat Analysis | 165 | 3.1 |
| 10 | Secure Software Development | 161 | 3.0 |
Which NICE work roles concentrate the most element coverage?
Power-law shape across the 41 NICE work roles
Cross-framework
Workforce
NICE
Per-work-role element counts across NICE Framework v2. The top five carry roughly a fifth of total element coverage. The long tail is real, and what ‘covers NICE’ actually means depends on which end of the distribution a curriculum reaches.
The question
How are NICE work-role element counts distributed across the 41 work roles, and how concentrated is the load at the top?
Why it matters
Curricula and training programs that “cover NICE” routinely do so by surveying its top work roles. Whether that approach reaches NICE’s specification surface depends on how concentrated the element load is. A flat distribution would mean the top five represent roughly an eighth of the total. A power-law would mean the top five carry a much larger share. The shape of the distribution is the question, and the answer reframes what “covers NICE” can credibly claim.
The element count per work role is the sum of NICE Tasks, Knowledge statements, and Skill statements attached to that role under cybed:hasElement.
The result
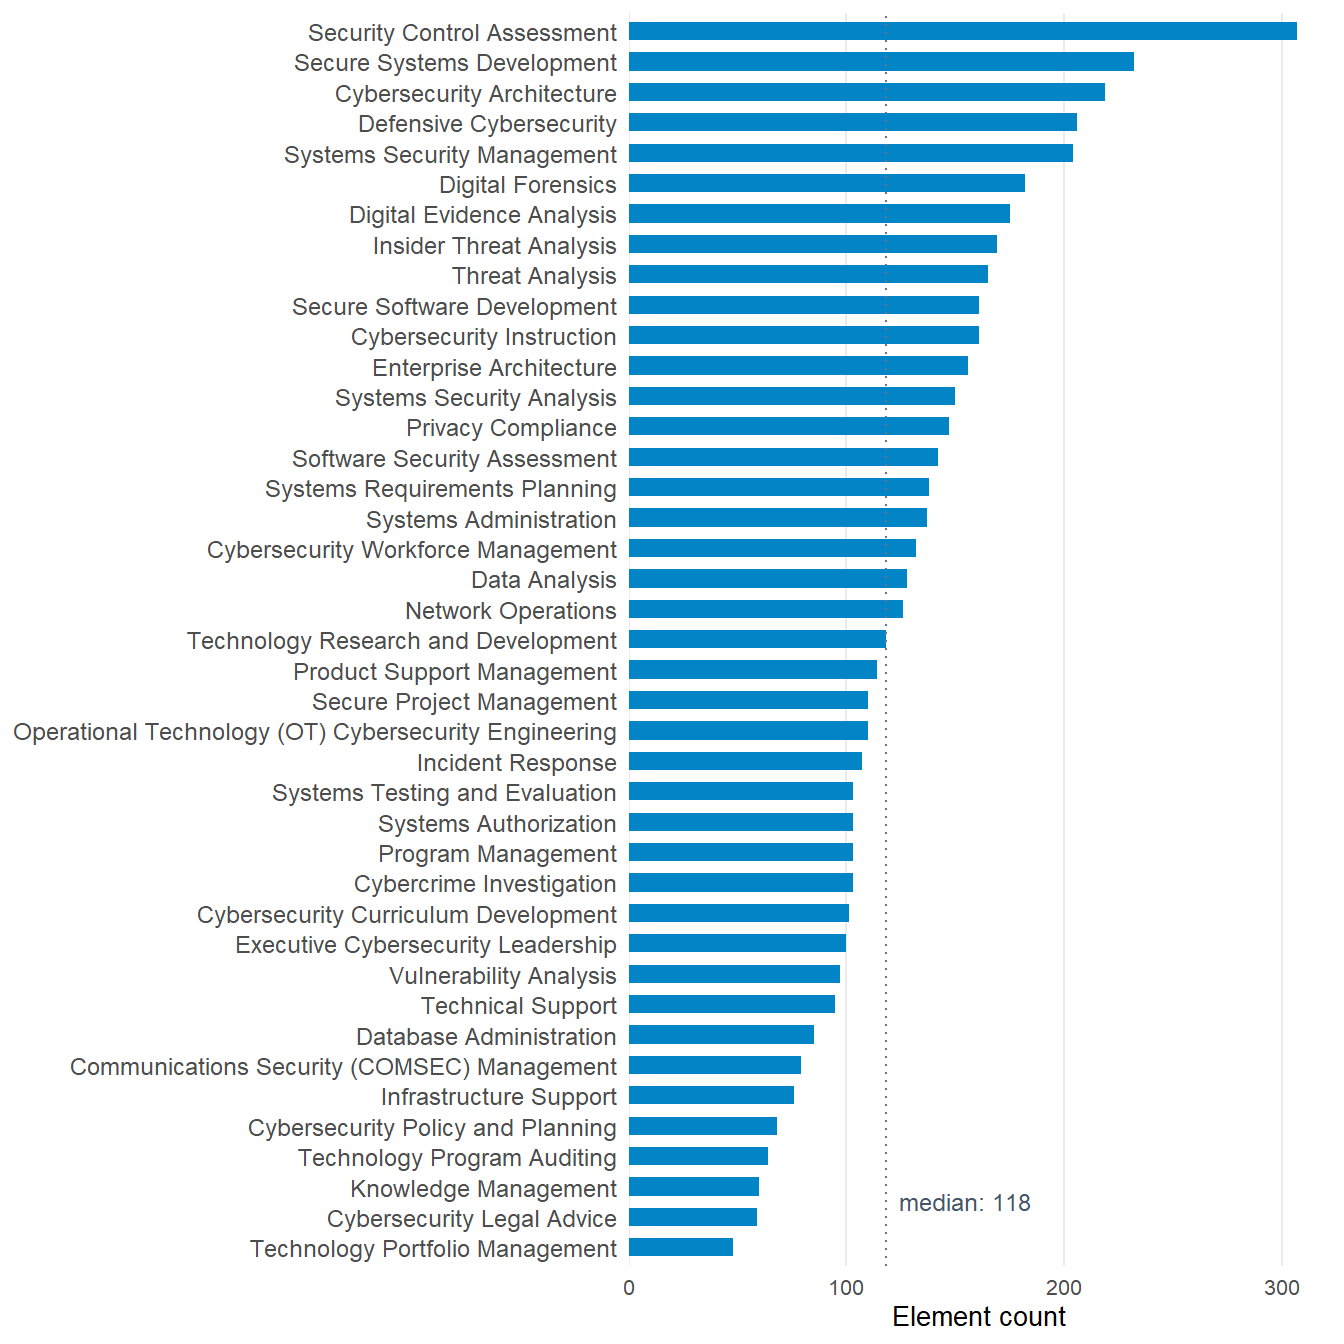
The top five work roles carry 21.9% of NICE’s element total. The top role (Security Control Assessment) lands at 307 elements. The median role sits at 118, which means the top role carries roughly 2.6 times the load of a median role.
What this tells us
The distribution is concentrated, not extreme
Top-five roles carry about a fifth of total elements. That’s well above flat-uniform (12.2% if every role were equal) and well below scale-free (where the top would carry half or more).
Top-five surveying reaches breadth, not the full corpus
Most of NICE’s specification body lives in the long tail. A program that limits coverage to the top five hits the densest specification surface but misses about four-fifths of NICE’s element load. Whether that matters depends on the program’s purpose. Workforce-pipeline preparation that wants to mirror federal hiring weights leans into the top end. Comprehensive curricular coverage needs the long tail too.
The shape is structural to NICE v2
The concentration reflects which work roles NIST chose to specify in depth. Roles like Security Control Assessment, Secure Systems Development, and Cybersecurity Architecture are built up with extensive Task and Knowledge statement libraries. Specialized roles in the long tail have leaner specification by design, not by oversight.
What this doesn’t tell us
Element count is specification weight, not workforce demand
A role with high element count is well-specified. It is not necessarily the role most US cyber jobs map onto. Workforce-demand evidence sits in BLS occupational data and CyberSeek, not in NICE element counts.
Element count is not curricular effort either
A curricular program may invest heavily in a role with leaner NICE specification because the topic itself is conceptually demanding. Elements measure what NICE specifies, not what teaching the topic requires.
This is a property of NICE v2
NICE Framework v1 distributed its specification differently. Comparisons across NICE versions need to refit element-count distributions per version, not assume the v2 shape carries.
Look up by NICE work role
The widget below ranks all 41 NICE work roles by element count. Search by role name to find a specific role’s position in the distribution.
Reproduce this
library(cybedtools)
library(dplyr)

rdf <- load_combined_ntriples_graph()

nice_role_counts <- role_framework_bindings(rdf) |>
  filter(grepl("^NICE", framework_name)) |>
  inner_join(
    role_element_bindings(rdf) |> count(role, name = "element_count"),
    by = "role"
  ) |>
  arrange(desc(element_count)) |>
  select(role_name, element_count)
The full prep script is in concordance/_data-prep-top-work-roles.R in the repository.